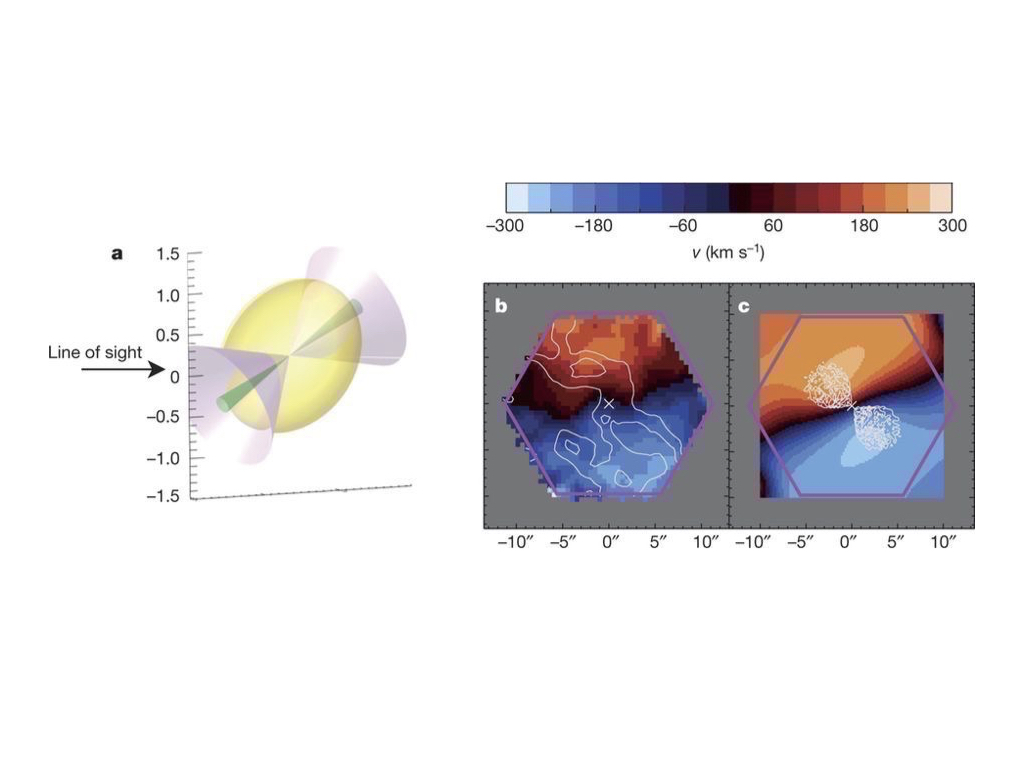
Large-scale outflowing wind : Roy et al. 2021A
Ionized gas kinematics from existing MaNGA data show that the 2D velocity field is consistent with radially outflowing wind. Cheung et al. 2016 constructed a toy wind model and showed that several predictions from the wind model, eg. high ionized gas velocity values, alignement of the velocity field with the Hα bi-symmetric pattern, and the features in the 2D kinematic maps are qualitatively consistent with that observed from MaNGA data. The wind model (left) and the resolved gas velocity map (from Hα) derived from MaNGA and the wind model (right) are shown below.
We get further evidence for the wind interpretation through followup Keck spectroscopy using the Echellete Spectrograph and Imager (ESI) instrument. The detailed gas kinematics from higher spectral resolution data (R ~ 8000) reveal that the strong line profiles, e.g.,Hα and [NII] show asymmetric profiles that depend systematically on location − extended blue wings on the red-shifted side of the galaxy and red wings on the opposite side.
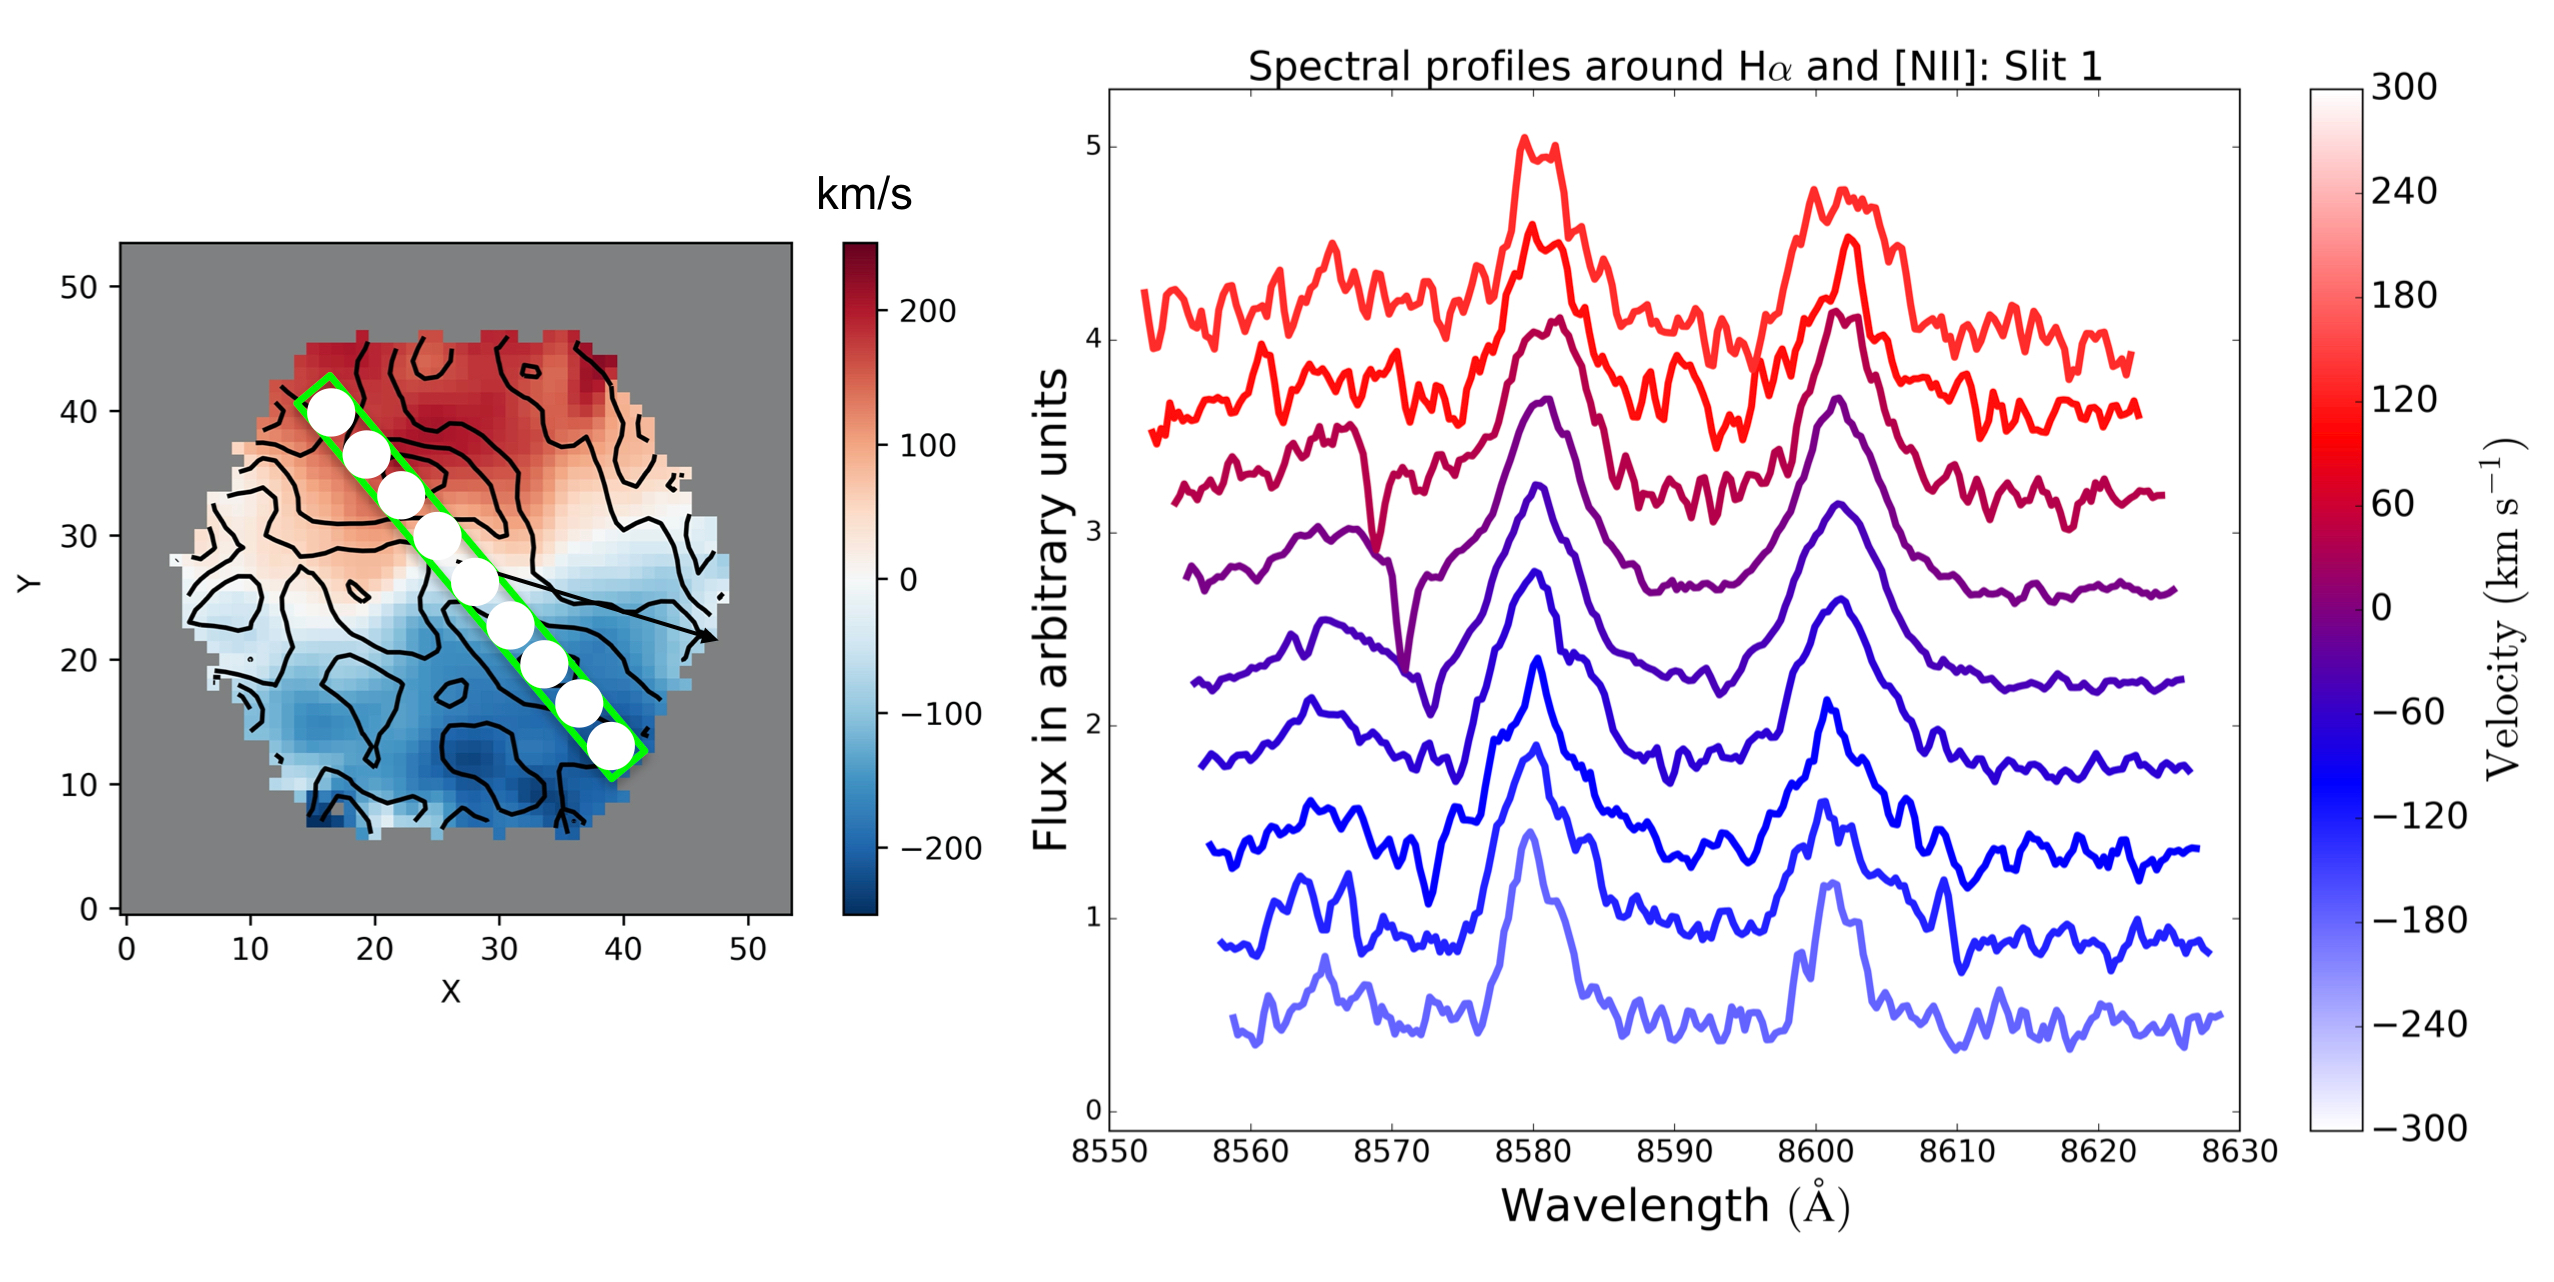
The panel on the left show the MaNGA ionized gas velocity field with the signature bi-symmetric Hα equivalent width contours in black. An ESI slit is overlaid on top, with wshite circles indicating spatial bins where the spectra are extracted. The different rows in the right panel shows the ESI spectra extracted along those spatial bins, color-coded by velocity. The emission lines shown in the spectral window are Hα on the left and [NII] on the right. We see the change in the asymmetry from bottom row to the top, i.e. a change in the asymmetry from the blue-shifted side of the galaxy to the red-shifted side. These results are consistent with geometric projections through an outflowing conical wind geometry. See Roy et al. 2021 for more details.